Skip to content

M.S. Business Analytics · UIUC Gies · May 2026

AbhinavSharma

Analytics professional: data analysis, BI and applied ML.

Open to: Data Analyst BI Analyst Business Analyst Data Scientist

Chicago, ILOpen to relocation anywhere in the US

Experience & practicums

  • Wolters Kluwer
  • AWG
  • Savvy
  • MESC
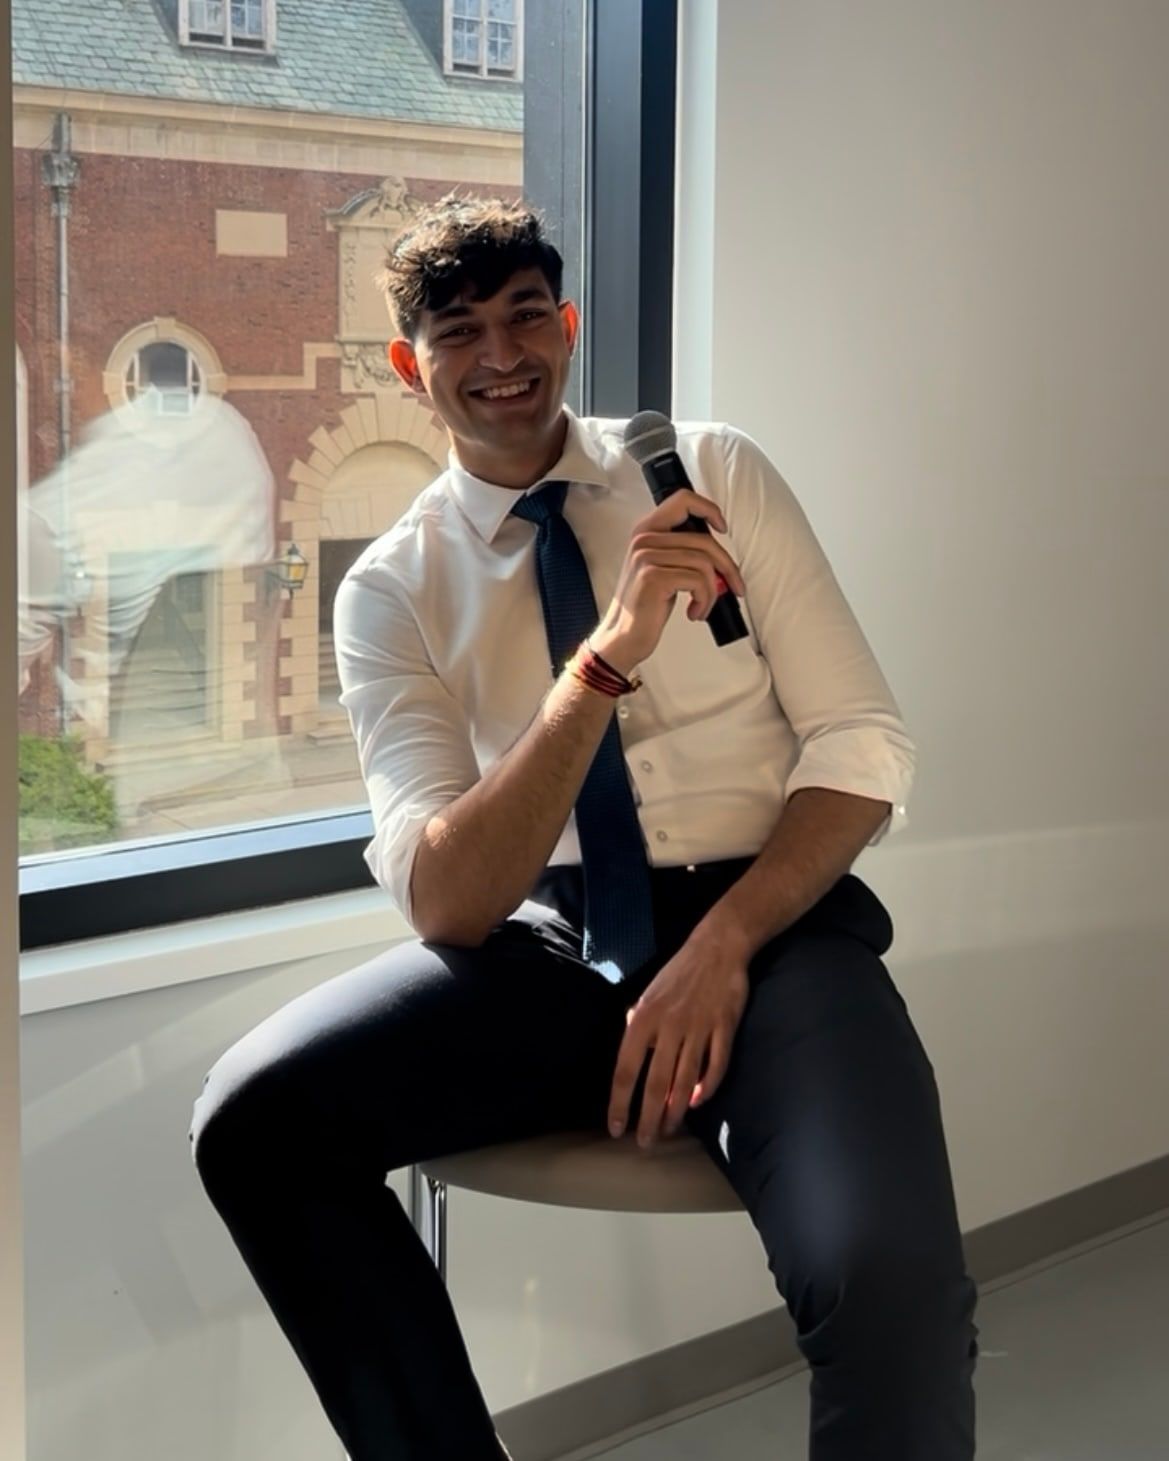
Abhinav Sharma smiling, holding a microphone, seated by a window in a white shirt and tie.

$21.4M

at-risk sales flagged

AWG pricing model

219,000+

shot events analyzed

NBA shot-quality model

By the numbers

Figures come from my resume and my project write-ups.

  • $21.4Min at-risk sales flagged from mispriced SKUsAWG · practicum
  • 80%fewer payroll errors caught in QC (about 40 → about 8 per cycle)Savvy
  • 60%shorter reporting lead time after data-quality checksMESC
  • 15+ hrsper week returned to the team by automated validationSavvy
  • 75%adoption lift from enrollment-prediction modelsMESC
  • 74–89%of supplier cost shocks absorbed by private-label brandsAWG · practicum

02Work

Selected case studies

Each one covers the problem, approach, impact and trade-off, including a result that didn't go my way.

01Associated Wholesale GrocersPracticum · Remote, USAAug 2025 – Dec 2025

Pricing & cost pass-through

Data analytics practicum for Associated Wholesale Grocers

Problem

This practicum for a $1.9B wholesaler covered two questions: where mispriced SKUs put sales at risk, and how supplier cost changes flow through to prices.

Approach

  • Python price-gap model on 4,800+ item-quarter observations, with price elasticity measured across 91 SKUs.
  • Cost pass-through model on 2,300+ supplier cost changes, split by private-label and national brands.
  • Tariff-exposure overlay on import-sensitive categories.

Impact

  • Flagged $21.4M in at-risk sales from mispriced SKUs.
  • Private-label brands absorbed 74–89% of cost shocks; national brands passed them through nearly in full.
  • Quantified a 6% cost spike in import-sensitive categories.

Trade-off

The private-label result is a range (74–89%) and the national-brand result is qualitative (near-full pass-through), so the analysis shows the direction of the gap, not a single precise figure.

  • Python
  • Pandas
  • Price Elasticity Modeling
  • Power BI
  • Excel

Share of supplier cost shocks absorbed

2,300+ supplier cost changes. Select a row for detail.

Absorbed 74–89% of cost shocks across 2,300+ supplier cost changes.

The national-brand band shows direction only, not a measured value.

$21.4M

at-risk sales flagged

6%

cost spike, import-sensitive categories

91

SKUs with measured elasticity
02

Verity

Citation-grounded equity research engine

Problem

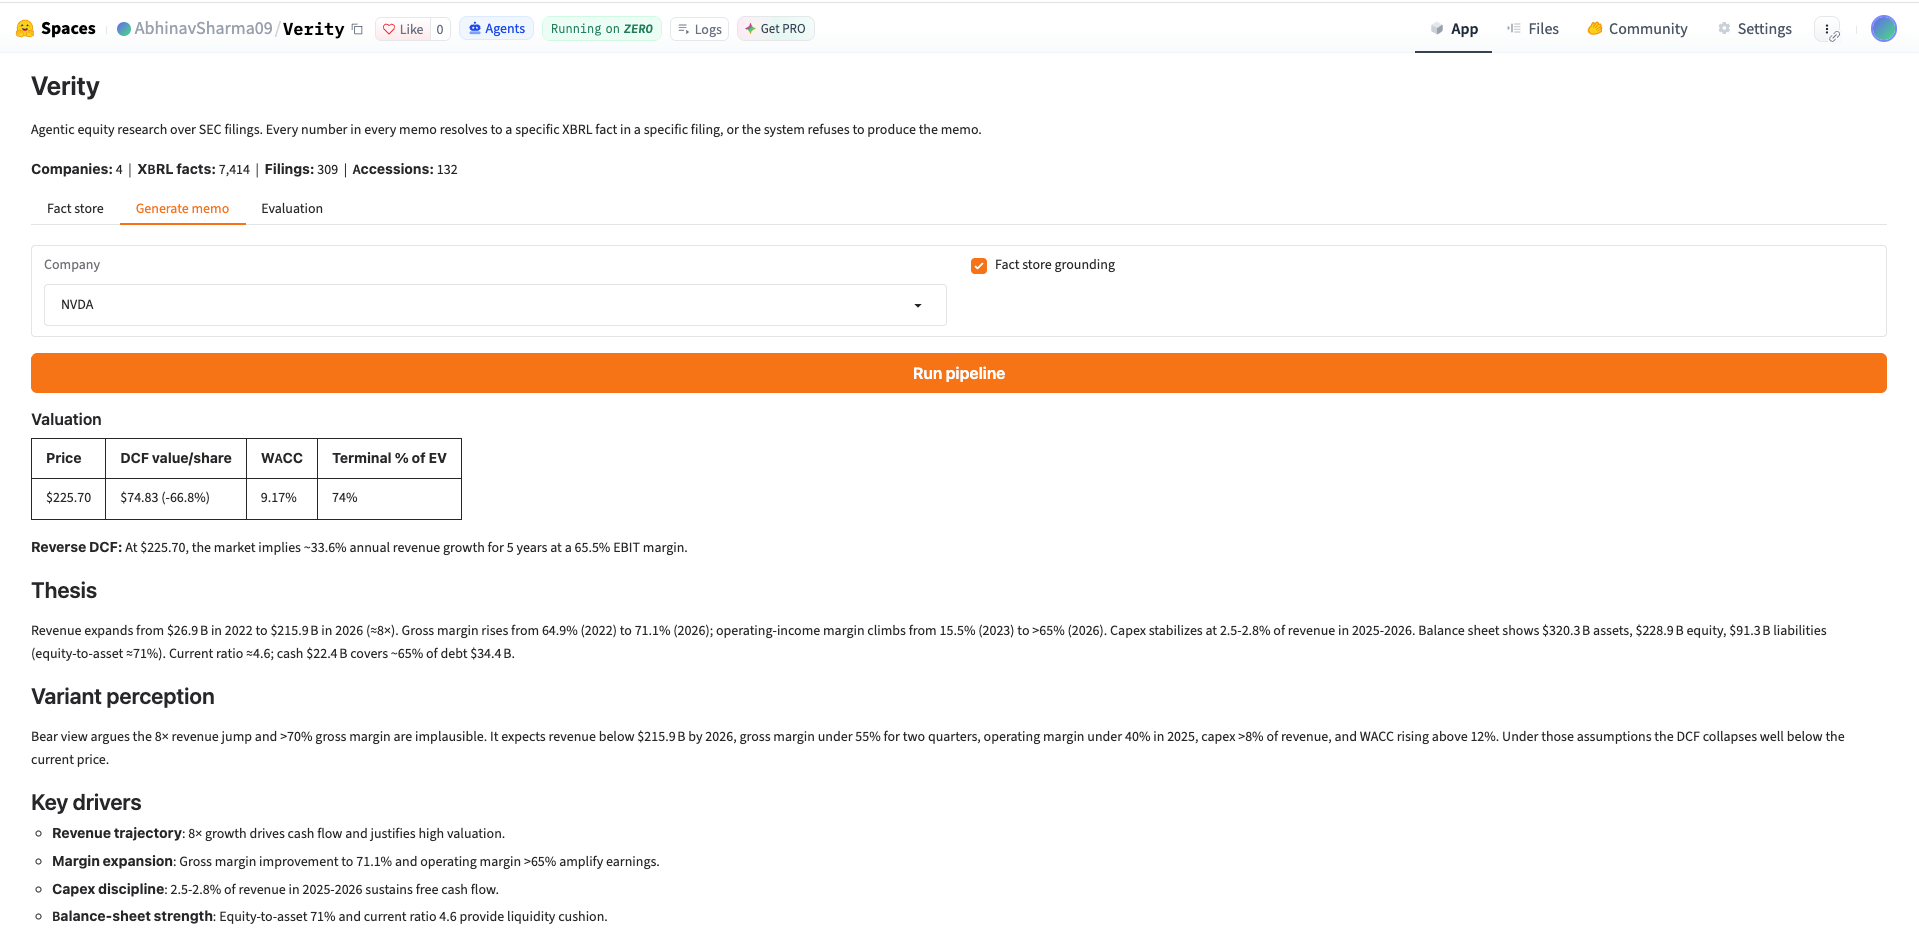
LLM-written equity research can state numbers that no filing supports. Verity’s rule: every number in a memo resolves to a specific XBRL fact in a specific SEC filing, or the system refuses to write the memo.

Approach

  • Built a point-in-time fact store from SEC EDGAR XBRL companyfacts in DuckDB: 7,414 facts across 4 companies, 309 filings and 132 accessions.
  • A 5-node LangGraph pipeline drafts each memo against the fact store. yfinance supplies prices only, and Groq is the default LLM provider.
  • Scope: the energy-and-compute complex (power generation, grid infrastructure, nuclear fuel cycle, compute). 62 pytest tests; packaged with Docker.

Impact

  • Numeric faithfulness of 69.9% across 83 claims checked in 2 memos.

Small sample: 83 claims across 2 memos. Read it as an early signal, not a benchmark.

Trade-off

By design, Verity refuses to write a memo rather than guess, so some requests produce no memo.

  • Python
  • DuckDB
  • LangGraph
  • SEC EDGAR XBRL
  • Groq
  • Docker
  • pytest

How a number is grounded

  1. 1Memo claim

    A number in the memo

    Every figure the memo states must cite its source.

  2. 2Fact-store row

    item · period_end · value · unit · form · filed

    Point-in-time row in DuckDB, built from SEC EDGAR XBRL companyfacts.

  3. 3SEC filing

    accession number

    Identifies the exact 10-K or 10-Q the value came from.

No match?The system refuses to write the memo.

Diagram (schematic, not a screenshot)
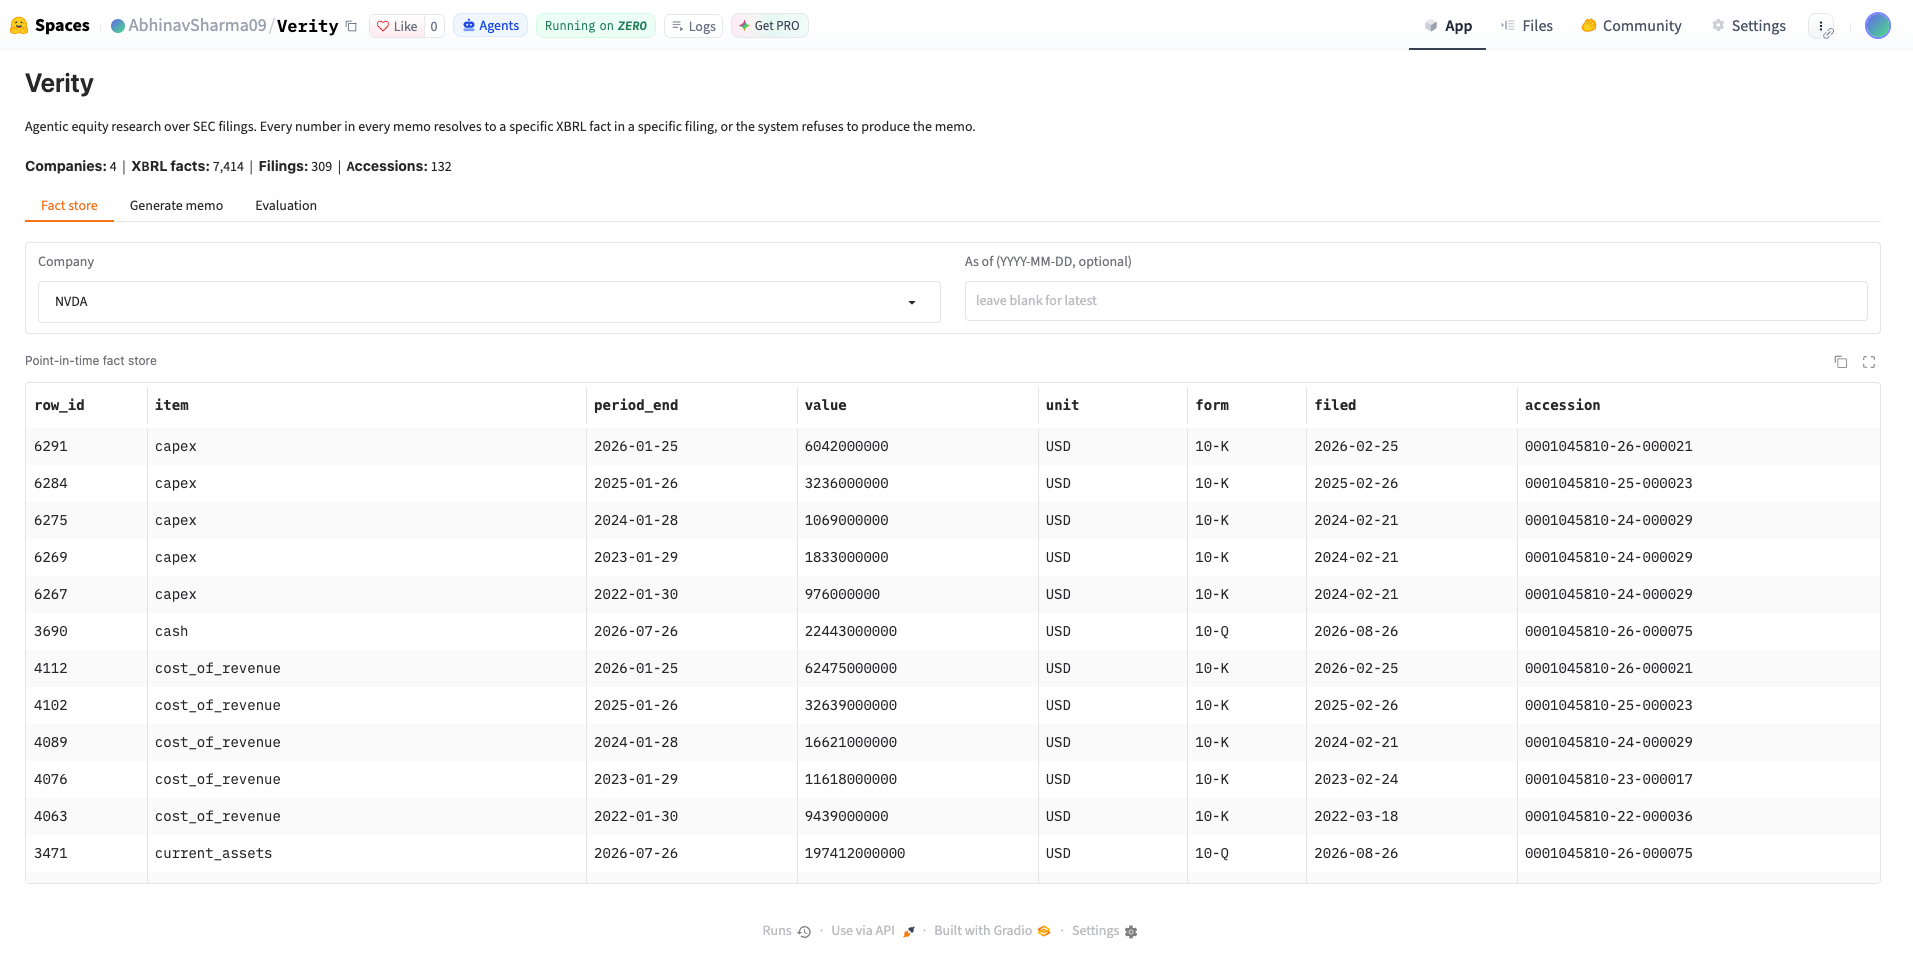
Verity fact store tab: a table of NVDA XBRL facts with item, period end, value, unit, form, filing date and accession number.
Point-in-time fact store: every value carries its form, filing date and accession number.
Verity generated memo for NVDA with a valuation table (price, DCF value per share, WACC, terminal share of EV), thesis, variant perception and key drivers.
Generated memo with fact-store grounding switched on.Illustrative; not investment advice.

03Apr 2026 – Jul 2026

Aura 2.0

Multi-agent LLM analytics platform

Problem

Business users ask questions in plain English; answering them usually means someone hand-writes SQL and then interprets the result. Aura turns the question into SQL-backed analysis.

Approach

  • Architected a 5-agent pipeline (Schema Discovery, SQL Engineer, Scientist, Strategist, Critic) that converts natural language into SQL-backed analysis on a 29-table database (Northwind SQLite).
  • The SQL Engineer retries a failed query up to 3 times, feeding the database error back to the model.
  • The Streamlit app calls the five agents as plain Python functions, once each, in sequence, with the Critic as a single final review whose verdict is shown but not acted on. The repo also defines a LangGraph graph with a Critic-to-Engineer revision loop (max 2 revisions); neither the app nor the backtest runs it.
  • A ChromaDB retrieval layer adds relevant past analyses to the SQL Engineer’s prompt as context. Ran on Groq LLaMA 3.3 70B, packaged with Docker.

Impact

  • 15-question backtest: 10 questions completed, all on the first SQL attempt.
  • The 3-attempt retry never had to fire: every completed query succeeded on attempt 1.

Small test set (15 questions) on a single sample database.

Trade-off

5 of the 15 questions did not complete: 2 code errors (a missing ‘confidence_score’ key) and 3 Groq rate-limit errors (HTTP 429). The Critic approved none of the answers. The LangGraph graph, including its revision loop, is defined in the repo but neither the app nor the backtest runs it.

  • Groq · LLaMA 3.3 70B
  • ChromaDB
  • Streamlit
  • SQL
  • Docker
Aura 2.0 architecture, as the app runs itA natural-language question flows through five agents in sequence: Schema Discovery, SQL Engineer, Scientist, Strategist and Critic. The Critic gives a single final review. The Northwind SQLite database (29 tables) is queried by the pipeline, and a ChromaDB memory of past analyses feeds the SQL Engineer's prompt. Output is SQL-backed analysis in a Streamlit UI. It ran on Groq LLaMA 3.3 70B, packaged with Docker, until Groq retired that model in August 2026.Natural-language questionNorthwind SQLite29 tablesChromaDB memorypast analyses → SQL Engineer prompt1Schema Discovery2SQL Engineer3Scientist4Strategist5Criticfinal reviewSQL-backed analysis · Streamlit UIRan on: Groq LLaMA 3.3 70B (retired Aug 2026)Docker
How the app runs: five agents once, in sequence, with the Critic as one final review. The demo is offline: Groq retired the LLaMA 3.3 70B model it ran on in August 2026. The backtest results above were produced on that model; the code is on GitHub.
Backtest: 15 questionsone square = one question
  • 10Completed· all on the first SQL attempt
  • 2Code error· missing ‘confidence_score’ key
  • 3Rate-limited· Groq HTTP 429

04Wolters KluwerPracticum · Remote, USAJan 2026 – May 2026

AI launch governance

AI product management practicum for Wolters Kluwer

Problem

A Fortune 500 AI product framework needed a repeatable way to keep hallucination-prone use cases from launching.

Approach

  • Three Go/No-Go checkpoints and a 40-point suitability scorecard.
  • Measurable launch requirements: 90%+ accuracy, under 3% hallucination across 500+ SME-verified queries, and 6s P95 latency.
  • Codified into an “AI-Aware Definition of Done” graded by Product, Legal and Engineering.

Impact

  • The scorecard stopped hallucination-prone use cases from launch.

Trade-off

A hard launch bar means some use cases do not ship. The 90%+ accuracy, under 3% hallucination and 6s P95 figures are the launch requirements I defined, not measured results.

  • LLM Evaluation
  • Prompt Engineering
  • AI Governance
  • Product Analytics
  • Python

From idea to launch: three gates

  1. Checkpoint 1

    Go / No-Go

  2. Checkpoint 2

    Go / No-Go

  3. Checkpoint 3

    Go / No-Go

40-point suitability scorecard screens each use case

Launch bar

  • 90%+

    accuracy

  • <3%

    hallucination across 500+ SME-verified queries

  • 6s

    P95 latency

Codified as an “AI-Aware Definition of Done”, graded by Product, Legal and Engineering.

05

NBA Spread Prediction

A leakage-safe model that found no edge, documented in a model card

Free tier: the first load can take 30-60 seconds to wake. The endpoints replay held-out 2024-25 games; they are not live betting predictions.

Problem

Can a leakage-safe machine-learning model beat market-implied closing spreads? To answer it, evaluation must never let future information leak into training.

Approach

  • Engineered an ML pipeline on 5,993 games from the NBA API and Kaggle betting-line and injury datasets, with 29 leakage-safe features (lagged before rolling) and pytest unit tests.
  • XGBoost on rolling team form and efficiency; strength of schedule, rest differential and streak were tested and dropped. 3-fold chronological cross-validation across 108 model fits.
  • Backtested on 1,225 held-out games against market-implied closing lines; containerized FastAPI service deployed on Render, with CI on GitHub Actions.

Impact

  • Found no edge, documented in a model card: held-out ROC-AUC 0.4793 across 1,225 games.
  • 2024-25 held-out accuracy 48.73% vs a 50.12% majority-class baseline; flat betting at −110 needs 52.38% to break even.
  • ROI −6.96% vs −4.78% always-home and −4.31% always-away.

Trade-off

The model did not beat the baselines. Leakage-safe evaluation showed there was no profitable, statistically robust edge against closing lines, which is the finding. Data limits: lines for 2020-21 to 2024-25; injury data only through April 2023.

  • Python
  • XGBoost
  • pytest
  • FastAPI
  • Docker
  • GitHub Actions

Held-out results vs simple baselines

Return on investment

  • Model−6.96%
  • Always home−4.78%
  • Always away−4.31%

bars grow left from 0% (axis to −8%)

Accuracy, 2024-25 held-out season

  • Model (2024-25 held-out)48.73%
  • Majority-class baseline50.12%
  • Break-even at −11052.38%

Feature ablation · mean ROC-AUC, 3-fold chronological CV

Baseline0.5164
+ strength of schedule0.5074
+ SOS, rest, streak0.5105
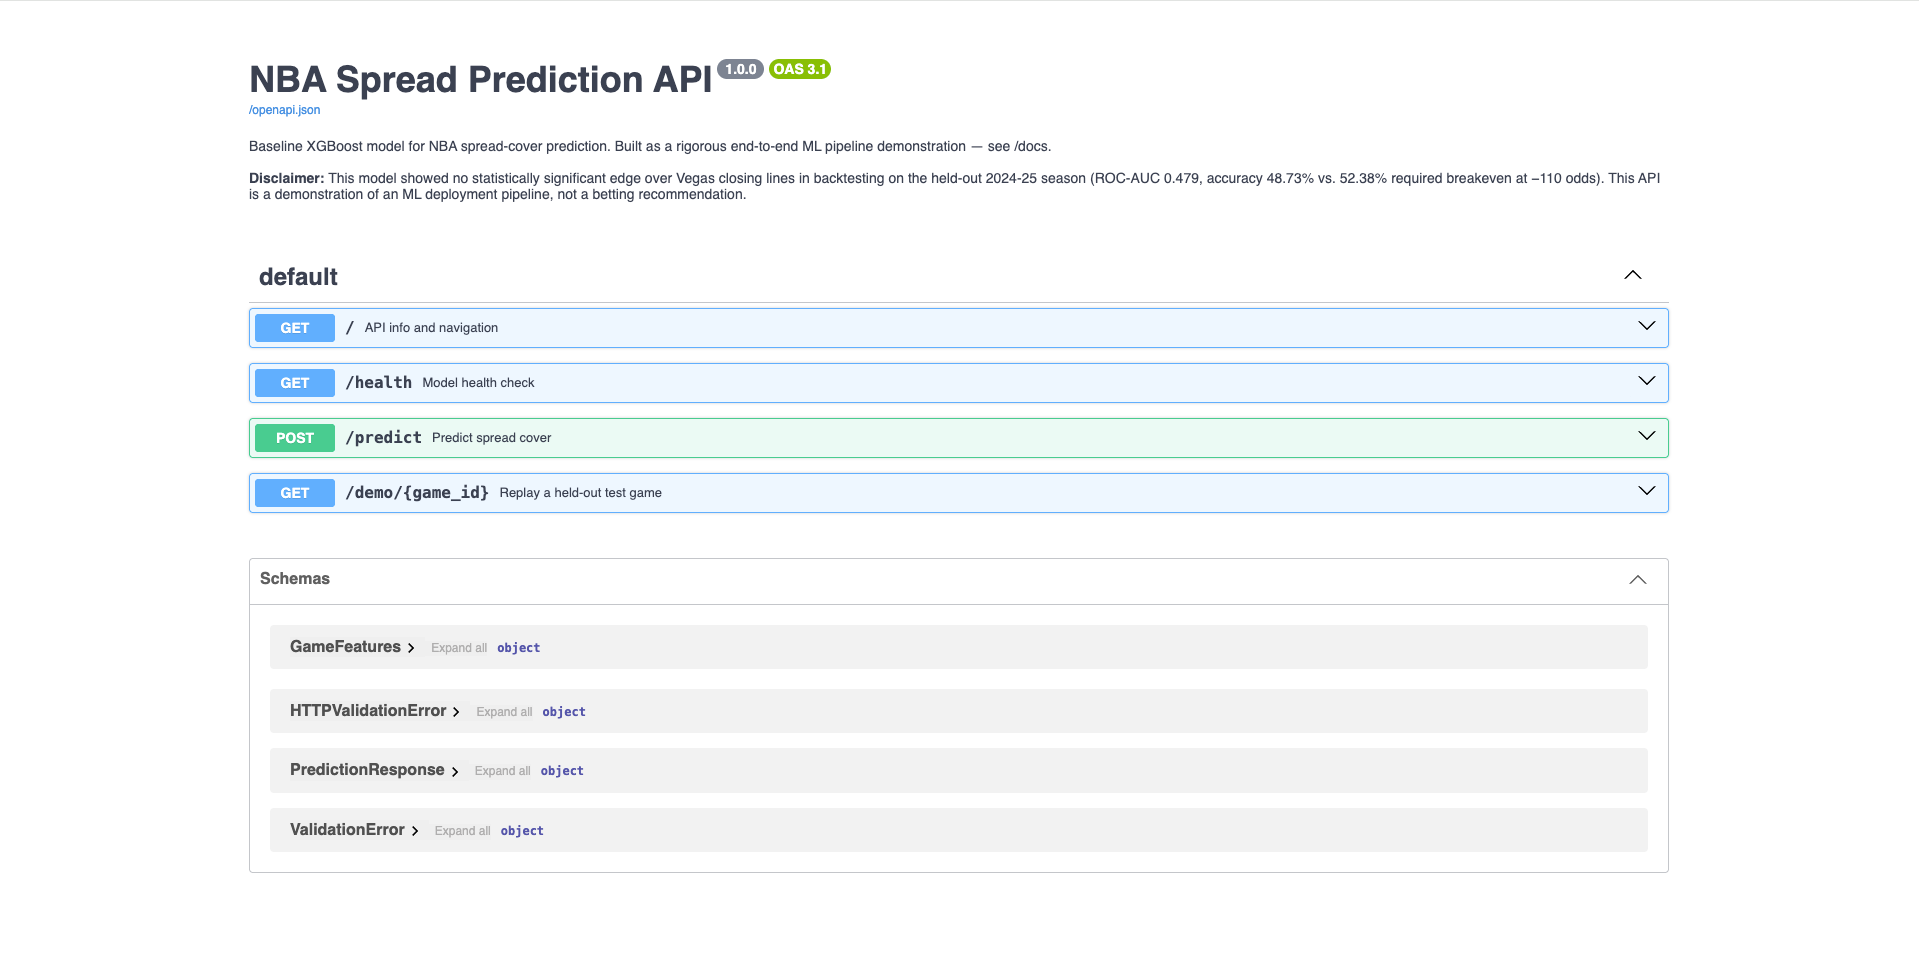
Swagger docs for the NBA Spread Prediction API with its disclaimer and four endpoints: info, health, predict and demo replay of a held-out game.
The API states its own result in the disclaimer.

06

NBA Spatial Shot Quality

Expected-points model for shot selection and role allocation

Problem

Field-goal percentage mixes shot quality with shot-making. Separating the two shows which players make hard shots and which shots a team should be taking.

Approach

  • 219,000+ shot events from the official NBA API (2025-26 regular season): spatial coordinates, shot type, game context and outcome.
  • Features: shot angle (arctan2), game clock as continuous time, spatial location with game-state context.
  • Built with XGBoost and Scikit-Learn, with a Streamlit dashboard and a Tableau team dashboard.

Impact

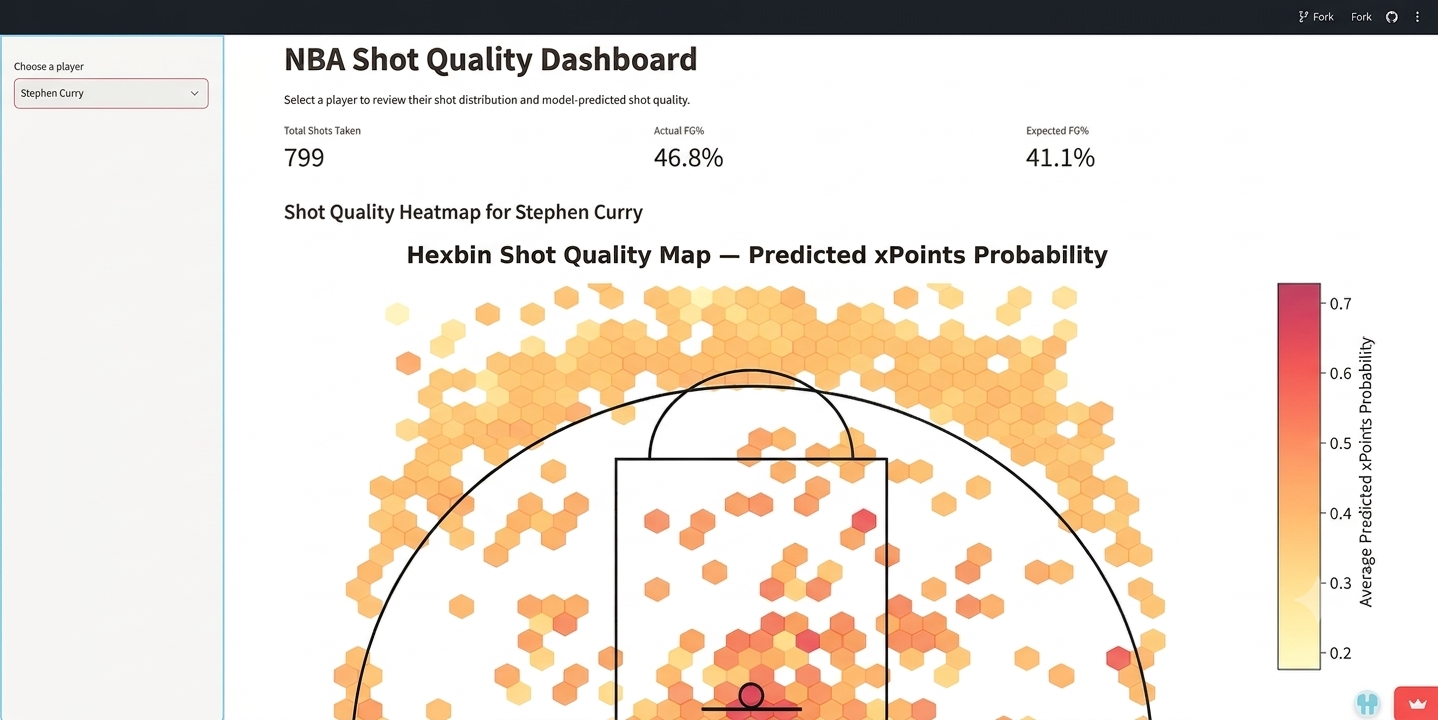
  • Dashboard example: Stephen Curry, 799 shots, actual FG% 46.8% vs expected 41.1%.
  • Baseline model: accuracy 63%, ROC-AUC 0.65.

Trade-off

This is a baseline model (accuracy 63%, ROC-AUC 0.65). No Brier score or calibration figures are reported yet, so the expected values have not been checked as calibrated probabilities.

  • Python
  • XGBoost
  • Scikit-Learn
  • Matplotlib
  • Seaborn
  • Streamlit
  • Tableau
NBA Shot Quality Dashboard for Stephen Curry: 799 total shots, actual FG% 46.8%, expected FG% 41.1%, with a hexbin map of predicted shot quality.
Player view: actual vs model-expected FG%, with a hexbin map of predicted shot quality.

63%

accuracy (baseline)

0.65

ROC-AUC (baseline)

03Experience

Where I've done the work

  1. AI Product Management Consultant

    Jan 2026 – May 2026

    Wolters KluwerPracticumRemote, USA

    • Established the governance backbone for a Fortune 500 AI product framework: three Go/No-Go checkpoints and a 40-point suitability scorecard that stopped hallucination-prone use cases from launch.
    • Defined measurable launch requirements (90%+ accuracy, under 3% hallucination across 500+ SME-verified queries, 6s P95 latency), codified into an “AI-Aware Definition of Done” graded by Product, Legal and Engineering.

    Skills:

    • LLM Evaluation
    • Prompt Engineering
    • AI Governance
    • Product Analytics
    • Python
  2. Data Analytics Consultant

    Aug 2025 – Dec 2025

    Associated Wholesale GrocersPracticumRemote, USA

    • Built a Python price-gap model on 4,800+ item-quarter observations for a $1.9B wholesaler, flagging $21.4M in at-risk sales from mispriced SKUs and measuring price elasticity across 91 SKUs.
    • Modeled cost pass-through on 2,300+ supplier cost changes: private-label brands absorbed 74–89% of cost shocks while national brands passed through nearly in full; a tariff-exposure overlay quantified a 6% cost spike in import-sensitive categories.

    Skills:

    • Python
    • Pandas
    • Price Elasticity Modeling
    • Power BI
    • Excel
  3. Business Analyst

    Mar 2025 – Jul 2025

    Savvy Corporate Services Pvt. Ltd.Delhi, India

    • Replaced manual re-keying of client attendance and wage sheets with Python/SQL pipelines that validate inputs before payroll and EPF return preparation, cutting errors caught in QC from about 40 to about 8 per payroll cycle (80%) and returning 15+ hours/week to the team.
    • Built a SQL-based compliance due-date tracker across client EPF, ESIC, professional tax, TDS and contract labor filings, roughly halving missed statutory deadlines.

    Skills:

    • Python
    • SQL
    • Data Validation
    • Process Automation
    • Compliance Reporting
  4. Data Analyst

    May 2023 – Jan 2025

    Media & Entertainment Skills CouncilDelhi, India

    • Owned SQL/SSIS ETL pipelines integrating workforce data from 200+ training centers across 12 sub-sectors, with dbt models on Snowflake; data-quality checks and validation cut reporting lead time 60%.
    • Built enrollment-prediction models to flag which courses and batches would fill and prioritize spend, delivered through Tableau/Power BI dashboards executives used directly, lifting conversion 60% and adoption 75%.

    Skills:

    • SQL
    • SSIS
    • ETL
    • Snowflake
    • dbt
    • Python
    • Tableau
    • Power BI
    • Predictive Modeling

Leadership

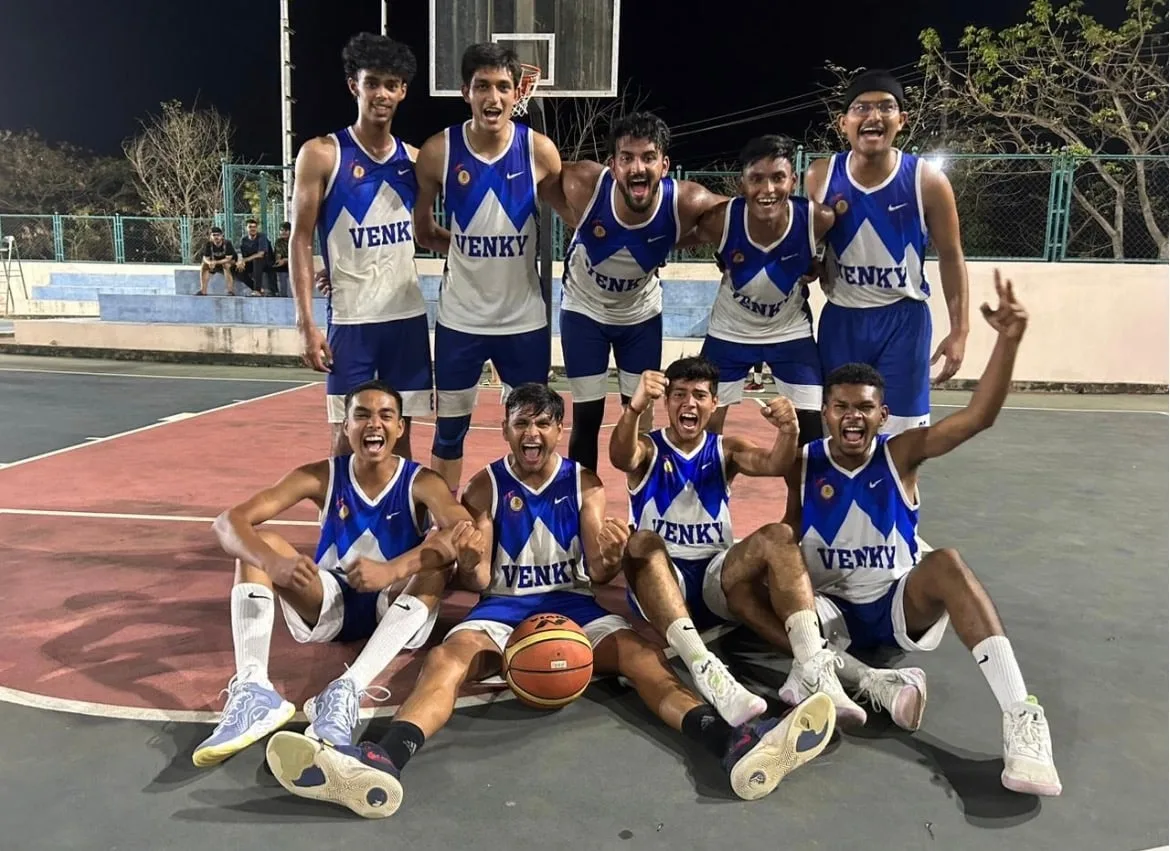
Sri Venkateswara College, University of Delhi

  • Advisory Council Member, Placement CellJan 2022 – Apr 2023

    Directed corporate outreach and recruiter relationships for placement drives; analyzed placement metrics and hiring trends; built Tableau/Power BI dashboards for the governing board.

  • Head, Sports Society

    Led the society, organizing athletics programs and events.

04Projects

All projects

Code, demos and dashboards. Each one links to its full case study above.

05Skills

Tools and methods

Grouped by type. No self-rated bars.

Languages & Data

  • Python (Pandas, NumPy, Scikit-Learn, XGBoost)
  • SQL
  • T-SQL
  • R
  • Snowflake
  • dbt
  • ETL/ELT (SSIS)
  • Data Modeling
  • Data Quality & Validation
  • Databricks
  • PySpark
  • FastAPI
  • Docker
  • CI/CD
  • Git/GitHub

Analytics & ML

  • Statistics
  • Regression
  • Classification
  • Forecasting (ARIMA)
  • NLP
  • A/B Testing & Experiment Design
  • Causal Inference
  • Predictive Modeling
  • Price Elasticity Modeling
BI & Reporting

  • Tableau
  • Power BI
  • Excel (advanced)
  • Dashboards
  • KPI Reporting
  • Data Storytelling
  • Process Automation

AI & Product

  • LLM Evaluation
  • RAG
  • ChromaDB
  • Prompt Engineering
  • LangGraph
  • Multi-Agent Systems
  • Natural-Language-to-SQL
  • Claude API
  • AI-Assisted Analytics (Claude Code, Cursor)
  • Requirements & Acceptance Criteria
  • AI Governance
  • Stakeholder Management

Coursework exposure

Used in coursework, not yet in a job.

  • AWS
  • Azure

06Education

Education & certifications

Gies College of Business, University of Illinois Urbana-Champaign

M.S. Business Analytics

University of Illinois Urbana-Champaign · Gies College of Business

Aug 2025 – May 2026 · Champaign, IL

Coursework

  • Big Data Analytics in Finance
  • Machine Learning in Finance
  • Enterprise Database Management
  • Topics in Business Intelligence
  • Consumer Analytics
  • Big Data Infrastructures
  • Data Science and Analytics
  • Data Storytelling
  • Business Practicum
Sri Venkateswara CollegeUniversity of Delhi

B.A. (Honours) English

University of Delhi · Sri Venkateswara College

Dec 2020 – May 2023 · Delhi, India

Certifications

  • PL-300 Power BIUdemy
  • Tableau 2024 A-ZUdemy
  • SQL for Data ScienceGreat Learning
  • Basic Proficiency in KNIME Analytics PlatformKNIME
  • Diploma in StatisticsIndian Institute of Skill Development Training
  • Data Science and Artificial IntelligenceBoston Institute of Analytics
  • Bloomberg Market Concepts (BMC)Bloomberg

07About

A little about me

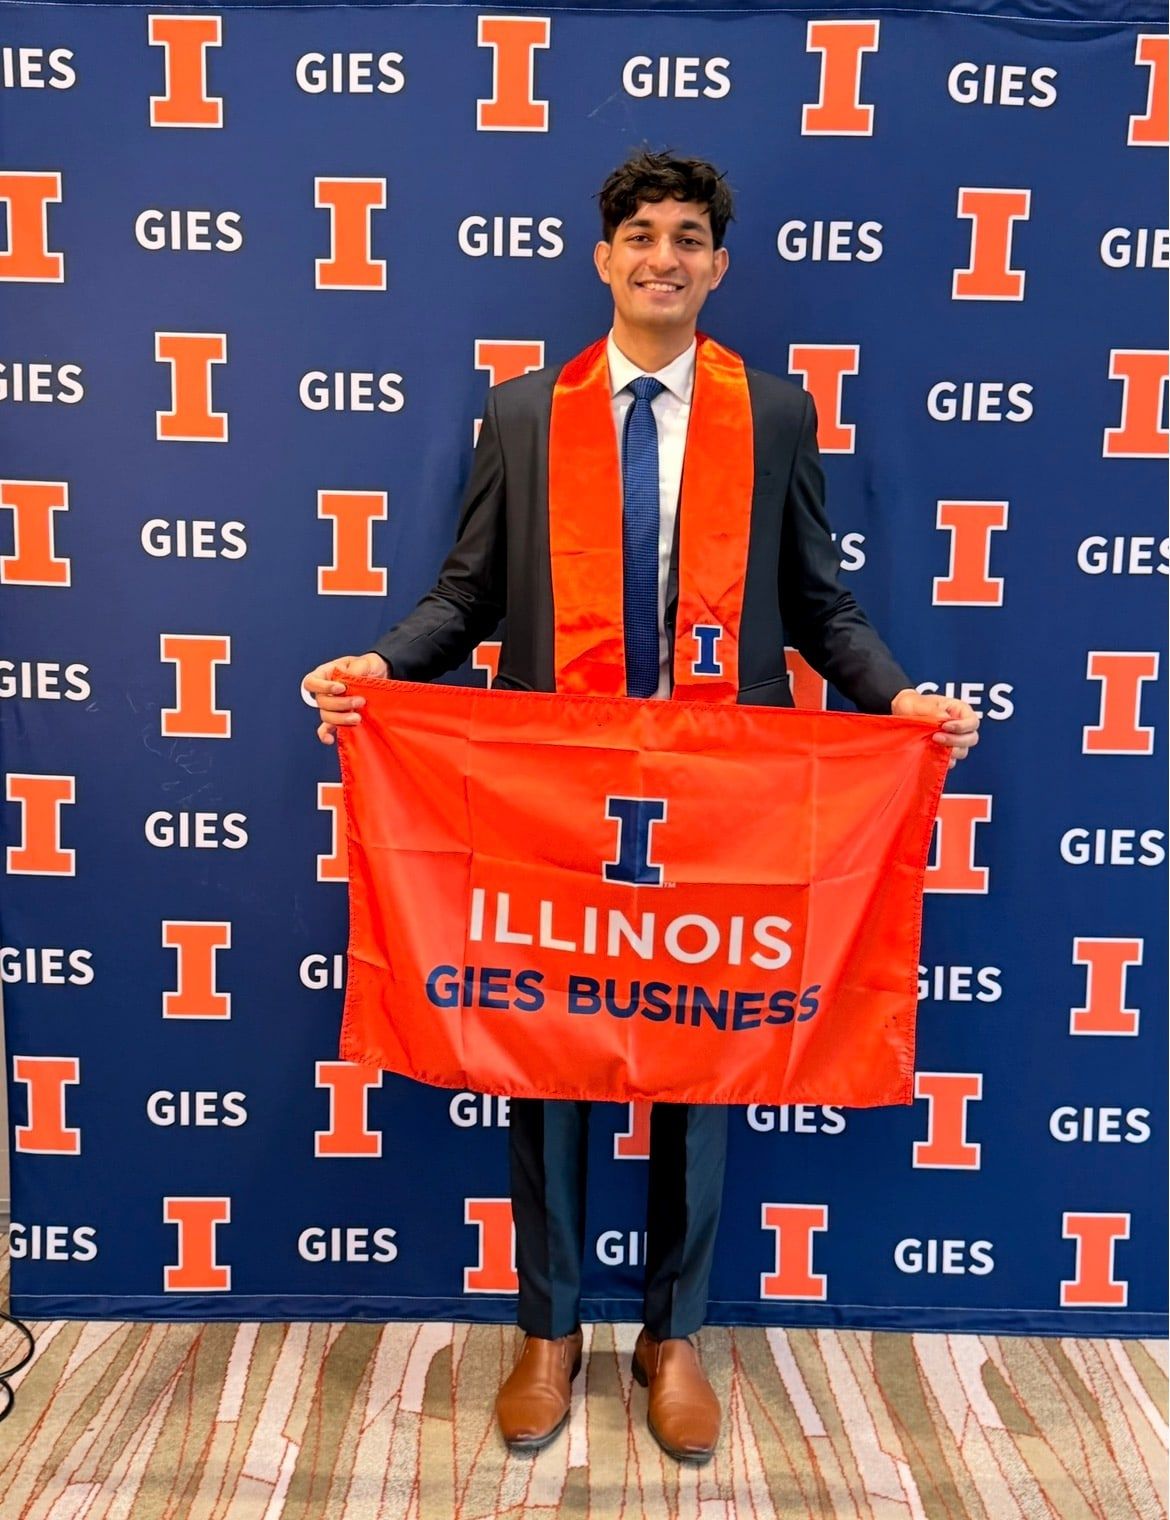
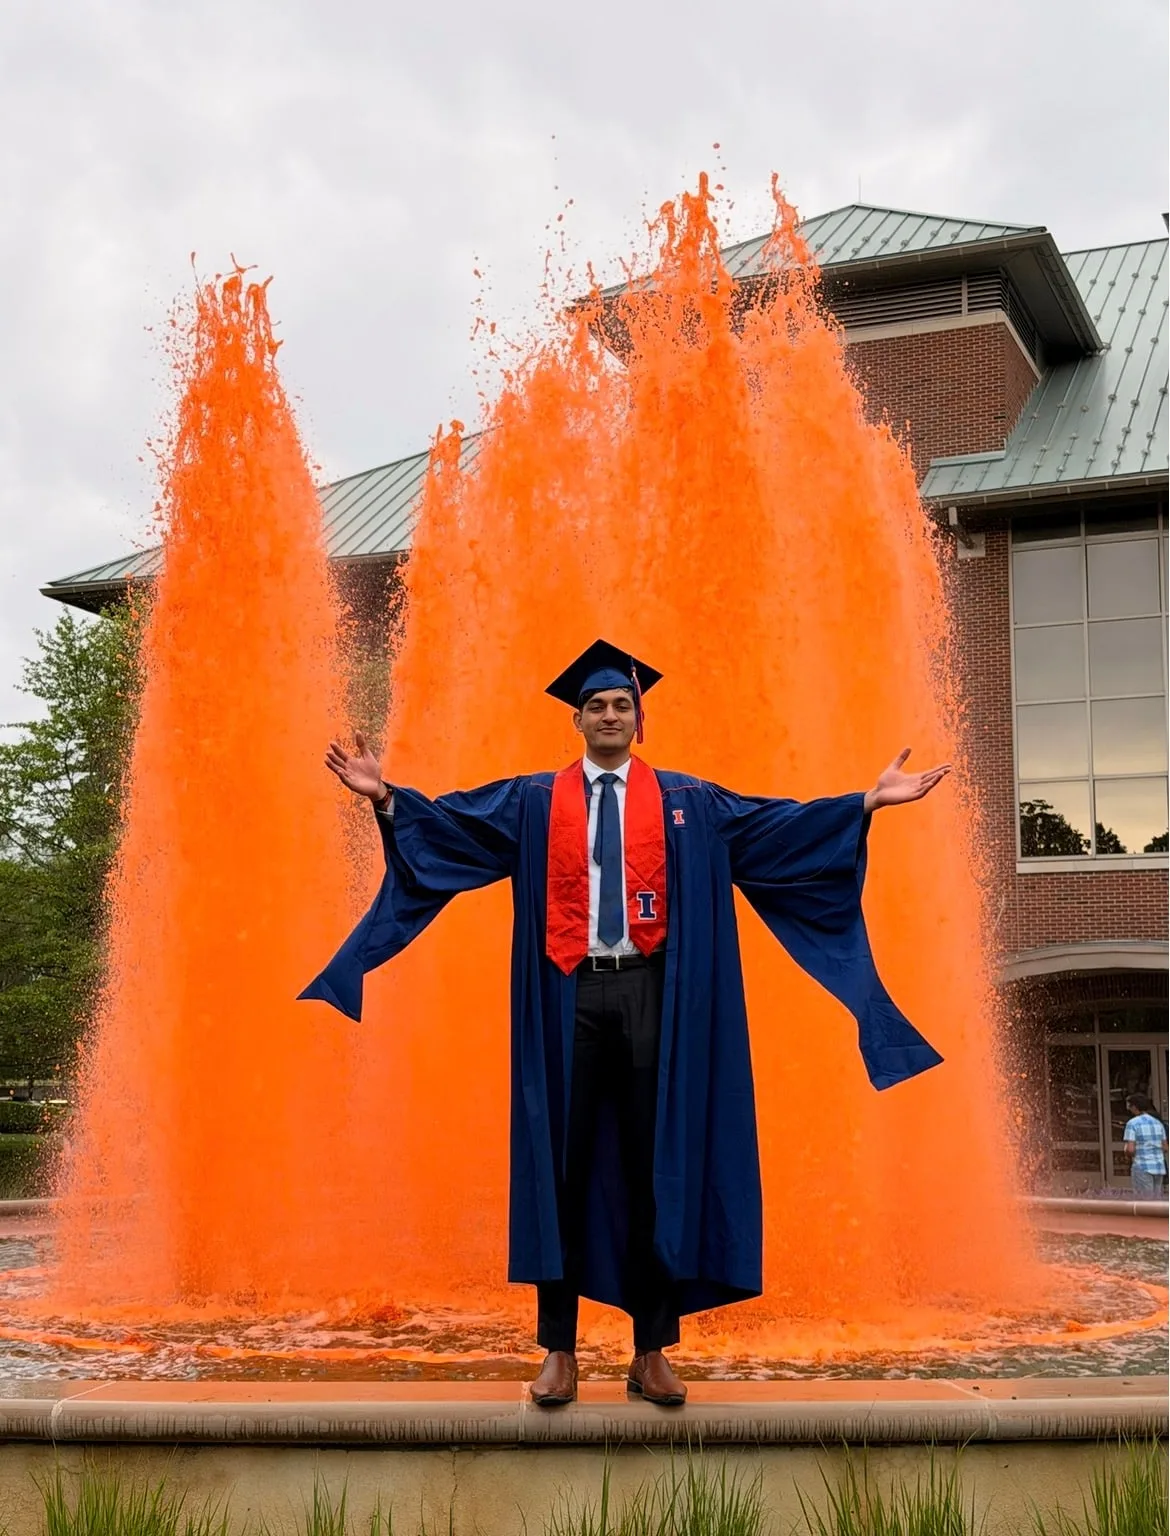
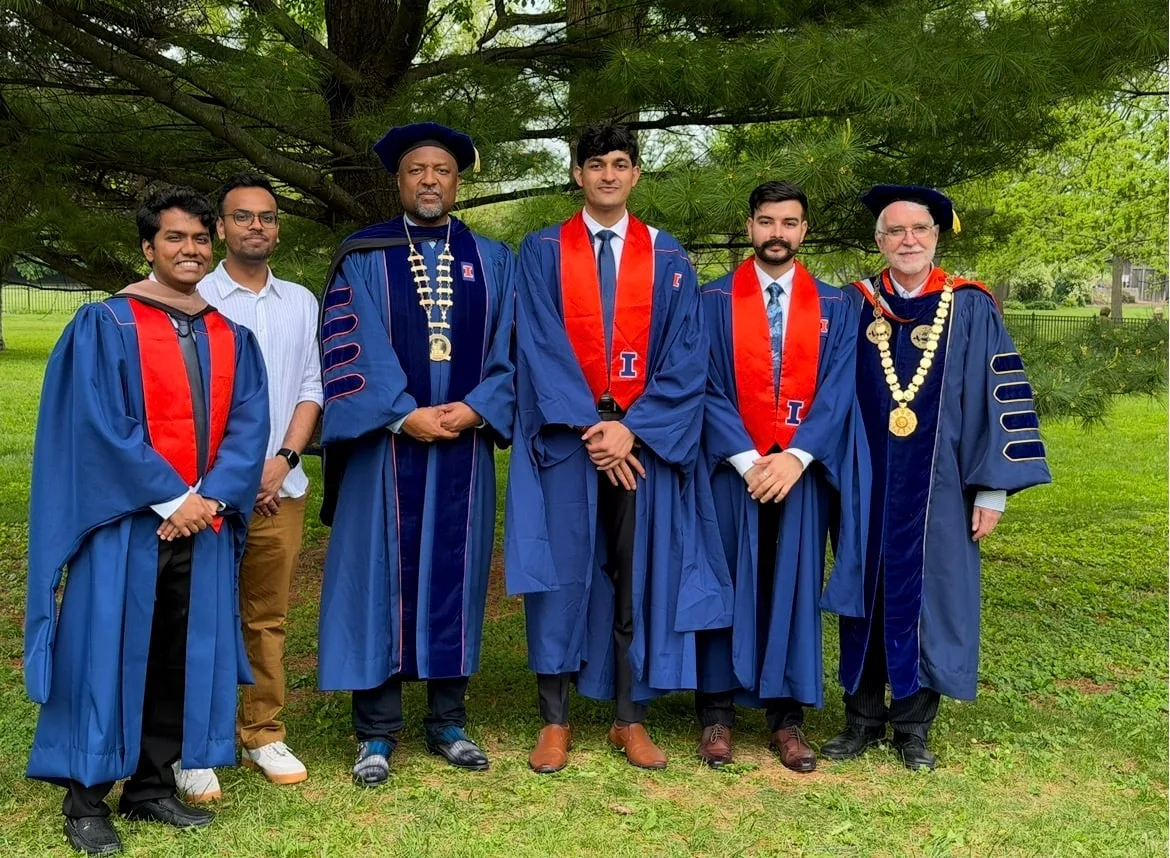
Abhinav Sharma in a suit and orange Illinois stole, smiling and holding an orange Illinois Gies Business flag in front of a Gies backdrop.
Graduation, May 2026

I’m an analytics professional in Chicago. I finished my M.S. in Business Analytics at Gies College of Business, University of Illinois Urbana-Champaign, in May 2026. Before that I studied English at Sri Venkateswara College, University of Delhi.

From May 2023 to January 2025 I was a Data Analyst at the Media & Entertainment Skills Council in Delhi, owning the SQL and SSIS pipelines behind reporting for 200+ training centers. I then joined Savvy Corporate Services as a Business Analyst, replacing manual payroll re-keying with Python and SQL checks. At Gies I took on two practicums: pricing analytics for Associated Wholesale Grocers and AI launch governance for Wolters Kluwer.

Two of my projects are built around honest evaluation: Verity refuses to write a memo it can’t ground in a filing, and my NBA spread model found no edge, which is documented in a model card.

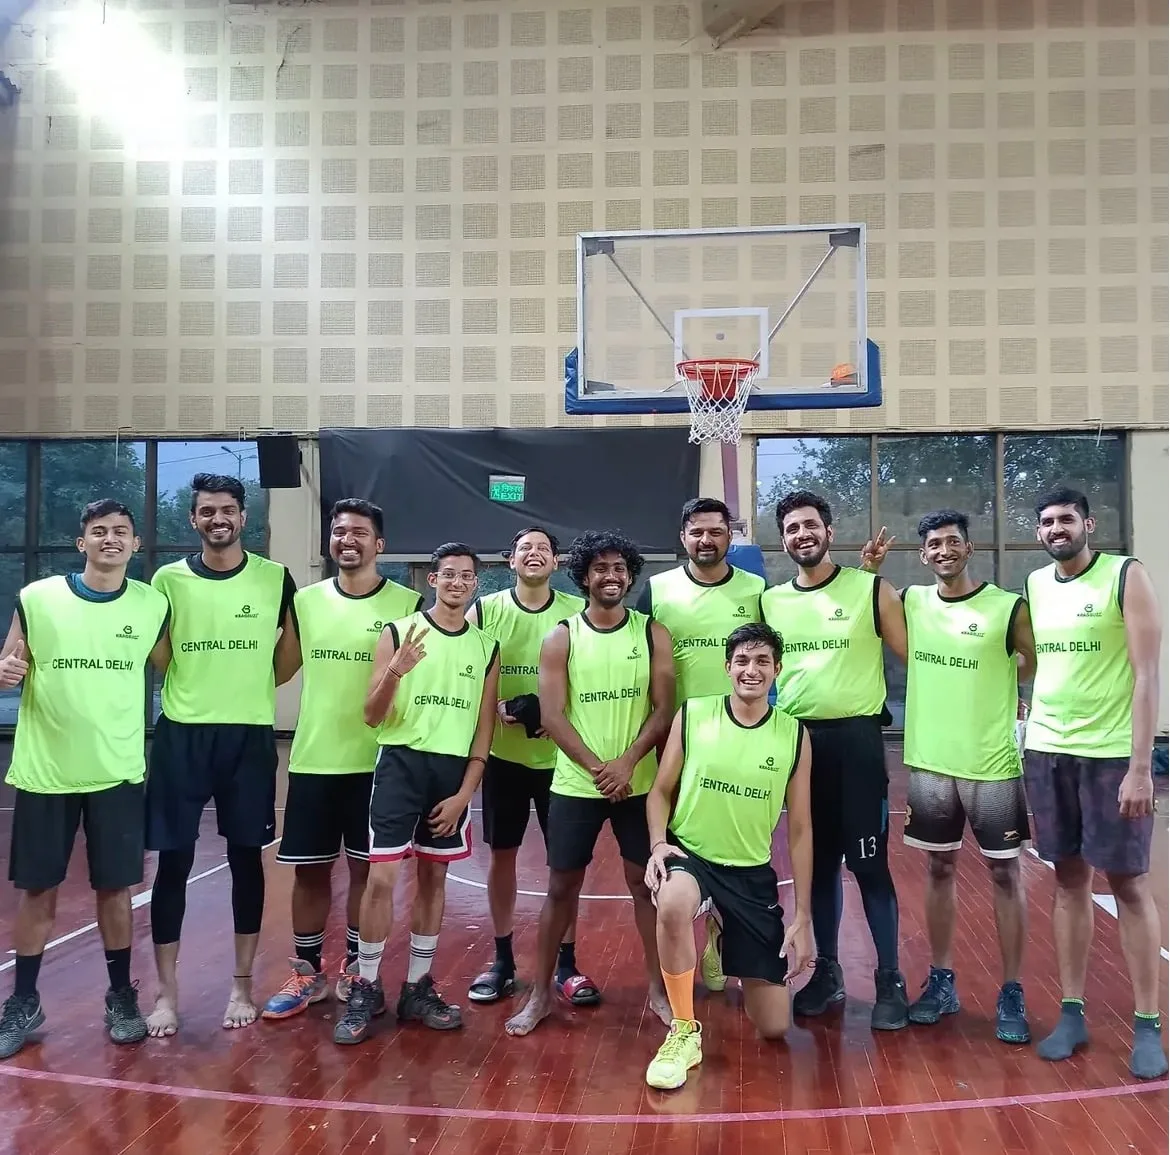
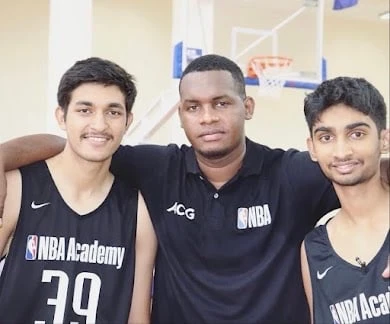
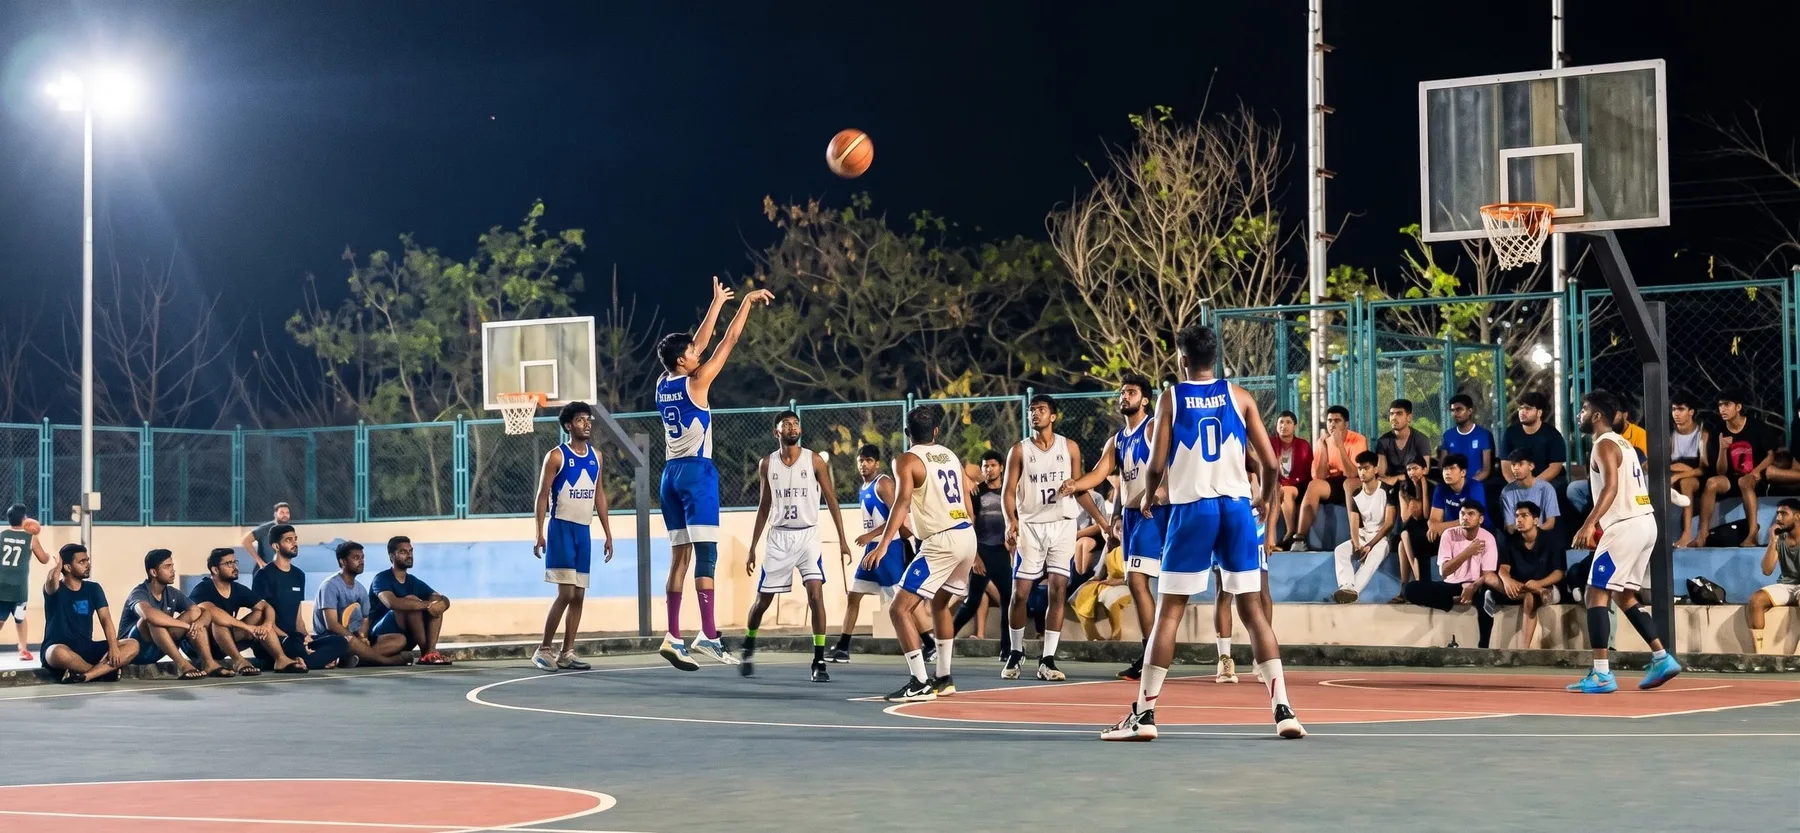
Outside work, it’s basketball: I played competitively, attended NBA Academy India, played college basketball in India and was Head of the Sports Society at Sri Venkateswara College.

Based in
Chicago, IL · open to relocation anywhere in the US
Education
M.S. Business Analytics, UIUC Gies (2026) · B.A. (Hons) English, University of Delhi (2023)
Open to
Data Analyst · BI Analyst · Business Analyst · Data Scientist

09Contact

Let’s talk

Open to Data Analyst, BI Analyst, Business Analyst and Data Scientist roles. Based in Chicago and open to relocation anywhere in the US. Email is the fastest way to reach me.

Prefer a document?Download my resume (PDF)